


In forex trading, price compression happens when the forces of buying and selling are nearly balanced. This balance results in low volatility and a narrow trading range. For traders, recognizing patterns like triangles and rectangles is key, as they indicate uncertainty in the market. Being able to identify these situations can significantly improve your trading approach, but it’s also crucial to manage the risks that come with them.
One effective way to spot price compression is to monitor price movements closely. For instance, when you see a series of lower highs and higher lows, it often suggests that the market is gearing up for a breakout. Additionally, using technical indicators such as Bollinger Bands can help visualize periods of low volatility, signaling potential trading opportunities.
What Is Price Compression in Forex Trading?

Price compression is a key market condition characterized by a near balance of buying and selling pressures. This balance results in low volatility and a tightly limited trading range. Essentially, price compression occurs when demand starts to diminish, which can lead to significant price shifts.
You can often spot price compression on charts through specific formations like triangles or rectangles. These formations signal market indecision, where traders are uncertain about the next direction prices will take.
By keeping an eye on narrowing price ranges alongside indicators of low volatility, traders can strategically position themselves for possible breakouts. This approach allows for better anticipation of market movements, enabling traders to take advantage of high-volatility scenarios when either buyers or sellers regain control.
Why Price Compression Matters to Forex Traders?
Price compression in forex trading refers to a period of narrow price movements, indicating market consolidation and potential upcoming volatility. It serves as a signal for traders to prepare for possible breakouts, either upwards or downwards, providing valuable insights for entry and exit points. Recognizing patterns of price compression can help traders manage risk, assess market sentiment, and utilize technical analysis for better trading strategies. Understanding these dynamics is essential for maximizing trading opportunities and anticipating market behavior.
Identifying Price Compression Patterns on Charts
Recognizing price compression patterns on charts is vital for traders looking to forecast important market shifts. These patterns often reveal periods where supply and demand are uncertain, which can lead to significant breakouts.
Here are some key formations to keep an eye on:
Triangle Patterns:
- Symmetrical Triangle: Formed when the price moves within converging trendlines. The highs are becoming lower, and the lows are becoming higher. This suggests indecision in the market, leading to a potential breakout.
- Ascending Triangle: Characterized by a flat upper trendline and rising lower trendline. This often indicates bullish sentiment, with buyers becoming more aggressive.
- Descending Triangle: Displays a flat lower trendline and a descending upper trendline, indicating bearish sentiment, with sellers increasingly dominating.
Rectangles: This formation shows price consolidation, where the market moves within established support and resistance levels.
Bollinger Band Squeezes: A squeeze happens when the Bollinger Bands narrow, signaling a time of low volatility, which typically precedes a breakout.
Candlestick Clusters: When small-bodied candles appear in a group, they often indicate a buildup of market tension, suggesting a potential for a significant price movement.
Common Pitfalls in Price Compression Trading and How to Sidestep Them
When engaging in price compression trading, it’s vital to recognize potential pitfalls that could disrupt your strategy.
- Ignoring Volume Indicators
Neglecting to consider volume indicators can significantly affect your understanding of market dynamics, especially during price compression phases.
Without paying attention to volume, you risk misinterpreting the strength behind price movements, which could lead to poor trading decisions. Here are some crucial points to keep in mind:
- Low volume often signals a lack of commitment to a price move, suggesting that the trend may not be reliable.
- A breakout that occurs alongside high volume serves as a strong signal, indicating that the price movement is likely to continue.
- Entering or exiting trades prematurely can happen when you react to misleading price fluctuations without volume confirmation.
Being aware of volume trends can improve your ability to predict possible reversals or breakouts, enhancing your trading strategy.
- Overtrading During Breakouts
Overtrading during breakouts can lead to serious issues, especially for traders who feel the urgency to act quickly when prices start to compress. If you jump into trades at every hint of compression, you may find yourself facing losses instead of waiting for clear breakout signals.
Entering trades too early can leave you vulnerable to false breakouts, which can reverse unexpectedly and lead to frustration and financial losses.
To navigate these situations effectively, it’s vital to keep an eye on the broader market context and overall trends. Getting too focused on one aspect can cloud your judgment.
Good risk management is also key—setting sensible stop-loss levels is especially important when dealing with high-volatility breakouts.
Practicing patience and choosing your trades carefully during these setups can significantly improve your trading results and lower the chances of overtrading. This approach allows for more thoughtful decision-making, ultimately leading to better outcomes.
- Misinterpreting Price Action
Misinterpreting price action during times of price compression can lead to significant trading errors. To enhance your trading results, keep an eye out for these common mistakes:
- Jumping the Gun: Entering trades too early, before a breakout is confirmed, can lead to unnecessary losses, particularly in uncertain market conditions.
- Excessive Trading: Viewing every compression pattern as a chance to trade can heighten risks and reduce your overall profitability.
- Overlooking Broader Market Trends: Ignoring significant macroeconomic factors can distort your perception of possible price movements during compression phases.
- Poor Risk Management: Not establishing suitable stop-loss levels can exacerbate losses when volatility increases following a compression period.
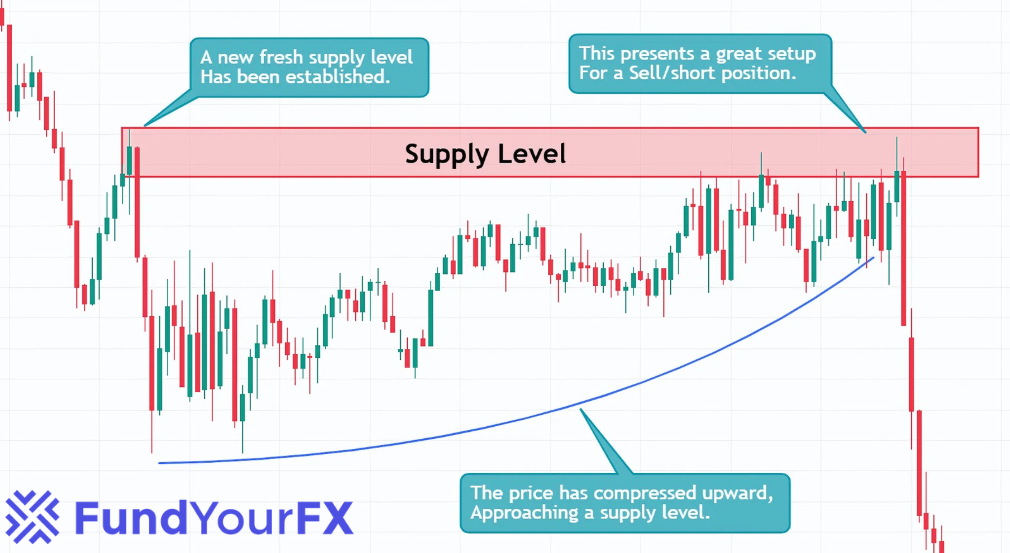
Real-Life Example of Price Compression Trading

When you spot a triangle pattern forming on a forex chart, it often indicates a real example of price compression trading. This phenomenon occurs as the prices create lower highs and higher lows within a tightening range. During this period, traders usually observe a drop in volatility, often shown by a Bollinger Band squeeze.
Historical trends suggest that about 75% of breakouts happen in the direction of the prevailing trend after this compression phase.
For example, consider a currency pair that consolidates between significant support and resistance levels. This scenario allows traders to develop breakout strategies at these critical points.
Additionally, when you notice small-bodied candles grouped closely together, it signals market indecision, which may precede a significant increase in volatility when the price eventually escapes this compression zone.
Conclusion
Price compression in forex trading indicates a phase where the market shows indecision, often resulting in notable price movements. Recognizing patterns such as triangles and rectangles can help you prepare for potential breakouts. Effective trading strategies and diligent risk management are vital in this low-volatility environment.