


When it comes to SMT divergence, understanding its nuances can considerably impact your trading strategy. You’ll find that recognizing the subtle differences between positive and negative correlations is key. But how exactly do these divergences signal potential market reversals? And what tools can you use to identify them effectively? Let’s explore these questions further to refine your approach and align with institutional movements.
What is ICT SMT Divergence?
ICT SMT divergence, or Smart Money Technique divergence, highlights a critical market phenomenon where two correlated assets display opposing price structures.
Fundamentally, when you see one asset making a higher high while its correlated counterpart fails to do so, that’s your cue for SMT divergence. This scenario indicates potential market manipulation and suggests a possible reversal in price trends.
Understanding what ICT and SMT mean is crucial for you as a trader. By identifying these divergences, you can align your strategies with those of institutional traders, enhancing your chances of successful trades.
Steering through the market becomes more intuitive when you tap into the insights provided by SMT divergence, making you feel more connected and part of a savvy trading community.
How to Use ICT SMT?
To effectively use ICT SMT divergence in your trading strategy, you must first identify the correlated assets that you’re interested in.
Look for pairs where one asset’s price action diverges from its counterpart, as this SMT divergence can signal potential reversals.
Monitor these assets on shorter time frames, ideally under 15 minutes, to catch divergences quickly. This method isn’t just for forex; it also applies to crypto.
You might wonder, does SMT divergence work on crypto? Absolutely! Many traders have seen success with pairs like BTC and ETH.
Positive and Negative Correlations in ICT SMT
In the domain of ICT SMT, understanding positive and negative correlations is essential for your trading strategy. Positive correlations mean that two assets move together, while negative correlations indicate they move in opposite directions.
Recognizing these patterns can help you anticipate market shifts and make smarter trading decisions.
Positive Correlation
While analyzing market dynamics, understanding positive correlation is essential for effective trading. When two assets, like EUR/USD and GBP/USD, move in the same direction, recognizing this can guide your strategies. This synchronous movement indicates strength in market trends, making it easier for you to spot potential opportunities.
You might wonder, “What is SMT divergence?” It occurs when correlated assets show opposing trends, signaling potential reversals. Now, is divergence a good indicator? Absolutely! By identifying these patterns, you can align your trades with market movements, enhancing your chances of success.
Embracing positive correlation not only builds your trading confidence but also fosters a sense of community among fellow traders who share similar insights and strategies.
Negative Correlation
How can understanding negative correlation enhance your trading strategy? By recognizing how negatively correlated assets move in opposite directions, you can spot potential reversals and seize trading opportunities.
For instance, when the US Dollar Index (DXY) rises while EUR/USD drops, it signals market shifts that you can capitalize on. Watching for divergence, like one asset forming a Higher High while the other doesn’t, helps you identify traps that could lead to profitable trades.
Incorporating this insight into your strategy not only aligns you with smart money movements but also builds your confidence in maneuvering the market’s complexities. Embrace this knowledge, and you’ll feel more connected to a community of informed traders.
Types of ICT SMT Divergence
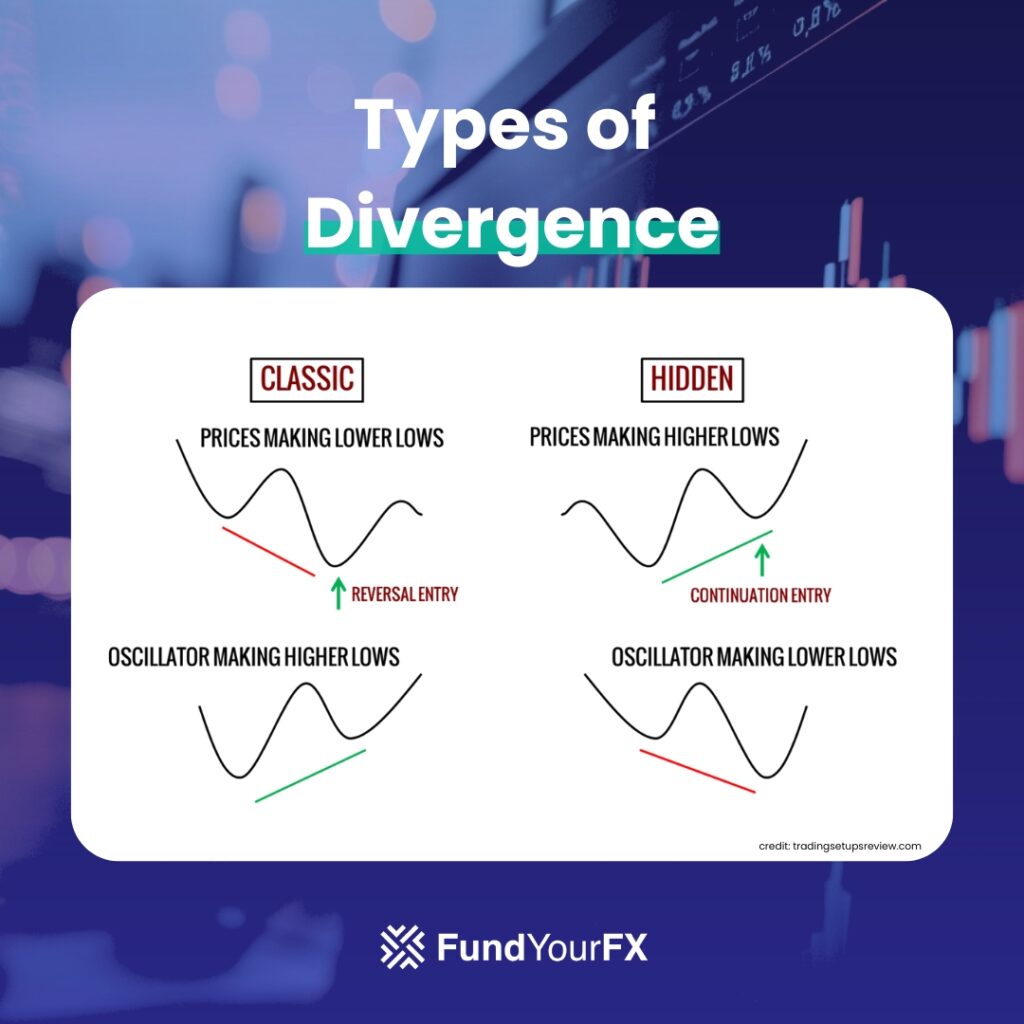
When exploring the types of ICT SMT divergence, you’ll encounter both bullish and bearish scenarios.
Bullish SMT divergence occurs when one asset forms a lower low while its counterpart creates a higher low, signaling potential market strength.
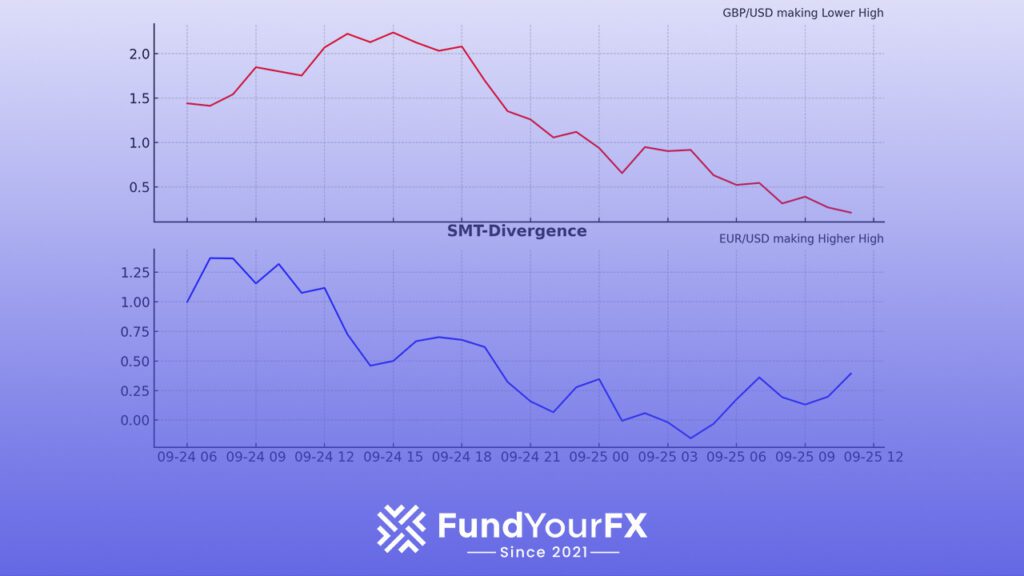
Conversely, bearish SMT divergence arises when one asset achieves a higher high while another falls to a lower high, hinting at possible market weakness.
Bullish SMT Divergence
Bullish SMT Divergence presents an opportunity for traders to spot potential reversals in the market.
When you observe one asset forming a Lower Low (LL) while its correlated pair creates a Higher Low (HL), you’re witnessing a significant signal. This divergence suggests that despite falling prices in one asset, the strength in the other hints at market resilience.
It’s like finding a hidden gem amidst uncertainty. You can effectively use this insight to align your trades with institutional movements, increasing your chances of success.
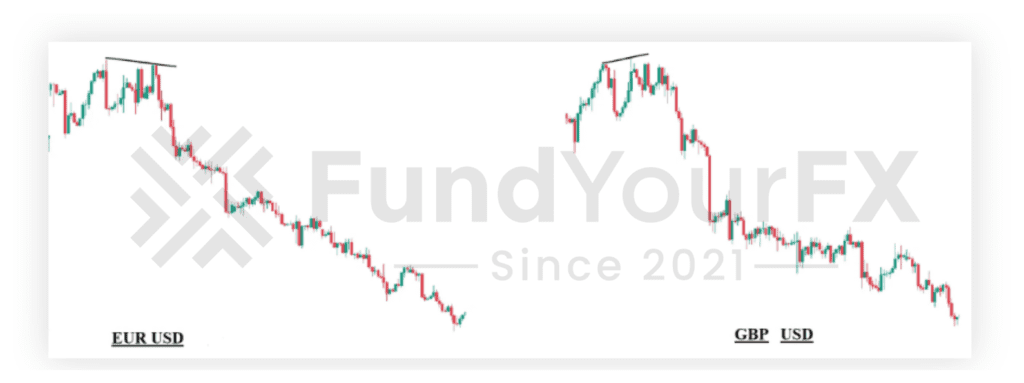
By analyzing pairs like EUR/USD and GBP/USD, you can confirm these divergences and make informed trading decisions.
Embrace this strategy, and connect with fellow traders who share the same passion for maneuvering market dynamics.
Bearish SMT Divergence
Bearish SMT Divergence offers traders a clear signal of potential market weakness and a possible reversal.
When you notice one asset forming a Higher High (HH) while its correlated counterpart makes a Lower High (LH), it’s time to pay attention. This divergence can indicate institutional manipulation, and understanding it can enhance your trading strategy.
Here are some emotions you might experience:
1. Anxiety – Fearing a market downturn.
2. Excitement – The thrill of identifying a potential opportunity.
3. Belonging – Connecting with fellow traders who share insights.
4. Empowerment – Gaining confidence in your trading decisions.
ICT SMT Divergence Indicator
The ICT SMT Divergence Indicator, developed by the TFLAB team, serves as an essential tool for traders looking to spot divergences among correlated assets.
By comparing charts of three related assets, this indicator highlights when one asset’s price action diverges from another, signaling potential reversals. For example, if EUR/USD forms a Higher High while GBP/USD does not, you can identify a possible trading opportunity.
It’s available for platforms like MetaTrader 4, MetaTrader 5, and TradingView, making it accessible for everyone.
To get the most out of it, monitor timeframes of 15 minutes or less, as higher timeframes might delay signals.
Embrace this tool to align your strategies with market movements and feel more confident in your trades.
Best Timeframes for Trading SMT Divergences
When you’re looking to trade SMT divergences effectively, focusing on lower timeframes can greatly enhance your results. By monitoring charts under 15 minutes, you can spot divergences quickly and capitalize on potential reversals before they fade.
Here are four compelling reasons to embrace lower timeframes:
1. Timely Entries: Capture market moves as they happen, boosting your chances of success.
2. Greater Precision: Identify subtle shifts in price action that higher timeframes might miss.
3. Dynamic Adaptability: React swiftly to changing market conditions, aligning with smart money.
4. Community Connection: Engage with fellow traders sharing insights in real-time, fostering a sense of belonging.
Adopting lower timeframes can transform your trading journey, making you more attuned to market dynamics.
Best Pairs for ICT SMT Divergence
Identifying the best pairs for ICT SMT divergence can greatly enhance your trading strategy. Start with the classic pairs like NQ (Nasdaq 100) and ES (SP500), which are positively correlated and offer reliable signals.
In the forex market, GBP/USD versus EUR/USD pairs are excellent choices for spotting divergences.
Metals traders should consider XAU/USD against XAG/USD for potential reversals. Additionally, keep an eye on the Dollar index for insights into broader market movements. The stronger the correlation, the more dependable your divergence signals will be.
By honing in on these pairs, you’ll find yourself better aligned with market trends, boosting your confidence and belonging within the trading community.
Common Mistakes in SMT Trading Divergence
Trading SMT divergence can considerably enhance your strategy, but it’s important to be aware of common pitfalls that can lead to misguided decisions.
By recognizing these mistakes, you can align yourself with the best practices of successful traders:
1. Ignoring broader market conditions when interpreting signals can mislead you.
2. Overrelying on indicators without additional analysis may cloud your judgment.
3. Inconsistent time frames can distort your understanding of divergences.
4. Chasing trends instead of focusing on early divergence signals can lead to missed opportunities.
Tools for SMT Trading Divergence
When it comes to SMT (Smart Money Trading) divergence, having the right tools can make all the difference in your trading journey. You want to verify you’re equipped to spot those critical moments where price action doesn’t align with market momentum. Here are some essential tools you might want to contemplate:
- Divergence Indicator: This tool helps you visually identify divergences between price and momentum indicators like RSI or MACD. It’s often the first step in spotting potential reversal points.
- Charting Software: A reliable charting platform allows you to analyze historical data, draw trend lines, and set alerts for potential divergence setups. Look for one that’s user-friendly and offers customizable features.
- Economic Calendar: Staying updated with major economic events can help you anticipate volatility and potential divergence scenarios. You’ll want to know when reports are coming out that could affect the markets.
- Community Forums: Joining a trading community can provide a sense of belonging and support. You can share insights, get feedback on your trades, and learn from others’ experiences with divergence trading.
By utilizing these tools, you’ll be better positioned to identify and act on SMT divergence opportunities. Remember, you’re not alone on this journey—there’s a whole community out there ready to support you!
Conclusion
To summarize, understanding SMT divergence can greatly enhance your trading strategies. By recognizing positive and negative correlations, and identifying different types of divergences, you can align your trades with institutional movements. Remember to use the right indicators, choose suitable timeframes and pairs, and avoid common mistakes. With the right tools and knowledge, you’ll be better equipped to navigate the market and make informed trading decisions. Embrace SMT divergence and watch your trading skills grow!