Best Indicators for Trading
Understanding the market is critical for maximizing returns. Trading indicators are available for this purpose. They are useful tools that should be utilized in conjunction with a thorough plan to maximize profits.
Technical analysis is used in many financial investment fields, although it is most often employed in forex trading, CFDs, commodities, cryptocurrencies, and indices. To comprehend price movement, you must first understand basic trade signals and use a trading platform with the best trading indicators integrated into the system.
It’s worthwhile to spend some time learning how each of these crucial indicators works and how you can use them in your market analysis and trading strategies.
1. Moving Averages
The moving average, often known as the “simple moving average” (SMA), is one of the most widely used technical indicators. Its purpose is to determine the direction of a current price trend without being affected by price spikes that are shorter in duration. The moving average indicator creates a single trend line by combining the price points of a financial instrument over a certain time frame into a single value and then dividing that value by the number of data points.
The data that is used is contingent upon the duration of the MA. For instance, a 200-day moving average (MA) needs data for 200 consecutive days. Studying levels of support and resistance, as well as viewing price movement from the past, is possible when you make use of the MA indicator. It also implies you can determine likely future patterns.
There is a wide variety of moving averages, and some traders employ more than one to verify the signals they receive from their trading systems. Some examples are weighted moving averages, exponential moving averages (which give greater weight to more recent values), and simple moving averages.
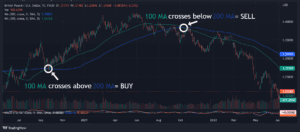
The chart below shows an example of buying when the 100-MA crosses above the 200-MA, signaling a bullish price action. And sell when the 100-MA crosses below the 200-MA signaling bearish price action.
In Summary:
MA signals a bullish or bearish price trend.
- Determines the trend’s direction.
- Determines the levels of support and resistance.
- Based on past prices.
2. Bollinger Bands
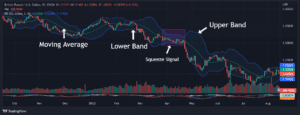
Bollinger Bands are a set of three lines that show volatility, which may be considered the price range they have historically traded inside. The band’s width moves up and down to reflect the recent volatility in the market. If these bands begin to contract (shrink), this is an indication of high fluctuations; on the other hand, if these bands begin to widen, this is an indication that an asset may contain low volatility.
Bollinger bands are primarily utilized as a strategy for predicting long-term price changes. Still, they can come in handy for identifying instances in which a particular asset is trading outside of its typical range. If the price of an asset keeps moving above the bounds of the band, this might indicate that it has been overbought, and if it keeps moving below the band, this could indicate that it has been oversold.
Traders that deal in stocks, options, futures, or forex may find this to be helpful because it provides information on the price behavior of the item they are trading.
In Summary:
It tells whether there is a squeeze or breakouts.
- Generate oversold or overbought signals.
- Composed of SMA + upper and lower band.
3. Relative Strength Index
The Relative Strength Index (RSI) is a tool traders use to understand a particular asset’s momentum and market conditions. It helps identify potential risks and opportunities related to price changes.
The RSI compares the current price of an asset to its past prices to determine how fast and how much the price has been moving.
A number between 0 and 100 represents the RSI. When the RSI is around 70, it suggests that the asset may be overbought, meaning its price has increased rapidly and might be due for a correction. When the RSI is around 30, it suggests that the asset may be oversold, meaning its price has decreased rapidly and might be due for a rally.
An overbought signal indicates that short-term price increases might be reaching a point where they can’t continue, and the asset may experience a market correction soon. On the other hand, an oversold signal suggests that short-term price decreases might be ending, and the asset may experience a rally soon.

In Summary:
70% or above is overbought or overvalued. 30% or below is oversold or undervalued.
- Signals bullish/bearish price momentum.
- Calculate using average price gains and losses over time.
4. MACD (Moving Average Convergence/Divergence)
MACD, short for Moving Average Convergence/Divergence, is a popular tool used by traders to measure momentum in the market. It involves two lines on a chart, each representing a different moving average.
When the line with a higher value crosses above the line with a lower value, it means the market is overbought, suggesting prices may be too high and could come down. On the other hand, when the line with a lower value crosses below the line with a higher value, it means the market is oversold, suggesting prices may be too low and could go up.
When both lines cross each other simultaneously, it indicates a possible change in trend. The MACD oscillator helps determine the best time to buy or sell assets.
The term “convergence” means the two moving averages are getting closer to each other, while “divergence” means they are moving apart. If the moving averages converge, it means momentum is decreasing, whereas if they diverge, it means momentum is increasing.

In Summary:
Over signal line means it’s a buy. Under signal line means it’s a sell
- Indicates if the price movement in the bullish or bearish direction is growing stronger or weaker.
5. On-Balance Volume
The On-Balance Volume Indicator (OBV) is a tool that looks at the volume of trades happening in the market. It adds up the volume when buyers are active and subtracts it when sellers are active.
By comparing the OBV to the green or red volume histograms usually seen at the bottom of price charts, the OBV gives more useful signals. It shows the relationship between volume and price movements, which can help traders make better decisions.
When more traders buy and hold positions for the long term, the buy OBV goes up. When more traders are selling and holding short positions, the sell OBV goes up. This information helps identify trends and potential buying or selling opportunities.
Some key things to keep in mind with OBV include the following:
- When the price and the OBV are both making higher peaks and higher troughs, it is likely that the upward trend will continue.
- When the price and the OBV are both making lower peaks and lower troughs, it is likely that the downward trend will continue.
- If the OBV is increasing while the price is trading in a range, this may indicate accumulation, which is a precursor to an upward breakthrough.
- If the OBV is decreasing while the price is trading in a range, this may indicate accumulation, which is a warning of a downward breakthrough.
- If the price keeps making higher peaks and the OBV keeps failing to achieve higher peaks, the upward trend is likely to plateau out or collapse altogether. This is referred to as a negative divergence.
- If the price keeps making lower troughs but the OBV doesn’t, the downward trend is likely to flatten out or fail. This is referred to as a positive divergence.

In Summary:
Can predict bullish/bearish outcomes.
- Uses volume changes to predict price.
- Shows crowd sentiment.
Conclusion
By incorporating the best trading indicators such as moving averages, Bollinger Bands, Relative Strength Index (RSI), MACD, and On-Balance-Volume (OBV), traders gain valuable insights into market dynamics, enabling informed trading decisions.
FundYourFX offers the unique advantage of instant funding, allowing traders to start trading with real funds immediately. There are no lengthy evaluation processes or trading challenges required. This immediate access to funding empowers traders to optimize their trading strategies and capitalize on market opportunities.
Partnering with FundYourFX enables traders to leverage the power of the best trading indicators and easily access real funds. Whether you are a novice or an experienced trader, FundYourFX’s instant funding prop firm provides a platform to trade with confidence and maximize your trading potential.
Maximize your trading potential and gain immediate access to real funds by joining FundYourFX, the award-winning instant funding prop firm. Experience the benefits of combining top trading indicators with FundYourFX’s instant funding model for a successful trading journey. Don’t miss out on this opportunity – join FundYourFX today and take your trading to new heights.